Diagramas de dispersión
Descripcion funcionalidad de Diagramas de Dispersión
The goal of representing the dispersion is to graphically observe the correlation between couple of bands of an image. To visualize the dispersion diagram, use the Remote Sensing toolbar selecting “Raster layer” from the left button and “dispersion diagram” from the left button. Check that in the scrolling text window, the layer over which you want to perform the diagram is selected.

The dialog window will appear as follow.
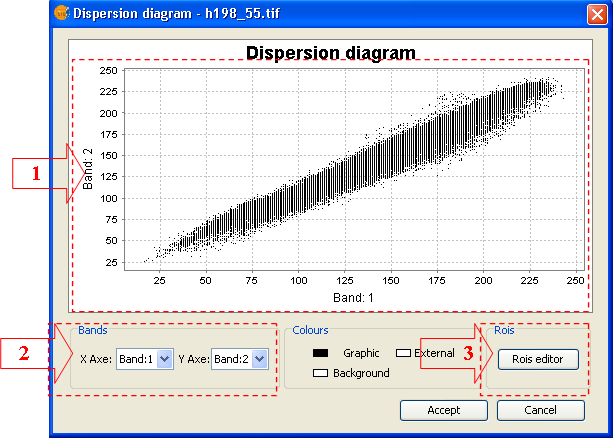
- Area where the graphic will be drawn. This graphic will change as the selected bands are changed. By default, the first graphic is created with band 1 and 2 of the image.
- Boxes of the selected bands.
- Option to show the graphic ROI editor.
Step by step to define new ROIs in the graphic
(1) Using the contextual menu

- Open the contextual menu over the diagram by right click.
- Choose New Class option
- Draw on the graphic the rectangular shape(s) delimiting ROI pixel values
(2) Using ROIs editor
- Click on ROIs Editor in the tool window. The editor will appear as follow

- By selecting "New" a new entry will be created in the table for managing the ROIs in the graphic. Then ROI name and colour can be modified. With the entry selected, draw rectangular(s) delimiting ROI pixel values in the represented bands.
Delete a ROI of the graphic
- Over the tool ROIs Editor select the entry corresponding to the ROI you want to delete.
- Click on "Delete"
Export a ROI of the graphic to a ROI in the layer
- Over the tool ROIs Editor select the entry corresponding to the ROI you want to export.
- Click on "Export"
- Once exported, the defined ROI will remain permanently linked to the image and will be managed as any other ROI created with the ROI editing. This new ROI will contain only point geometry
-----------------------------------
- Se ha producido un error en el documento Descripcion funcionalidad de Diagramas de Dispersión , accediendo a la imagen dispersion_Rois.png, que probablemente no existe. No se han encontrado alternativas
